About This Map
The Tennessee Fatal Crash Map (2020–2024) uses data from the National Highway Traffic Safety Administration (NHTSA).
The dataset covers fatal vehicle crashes in Tennessee between 2020 and 2024.
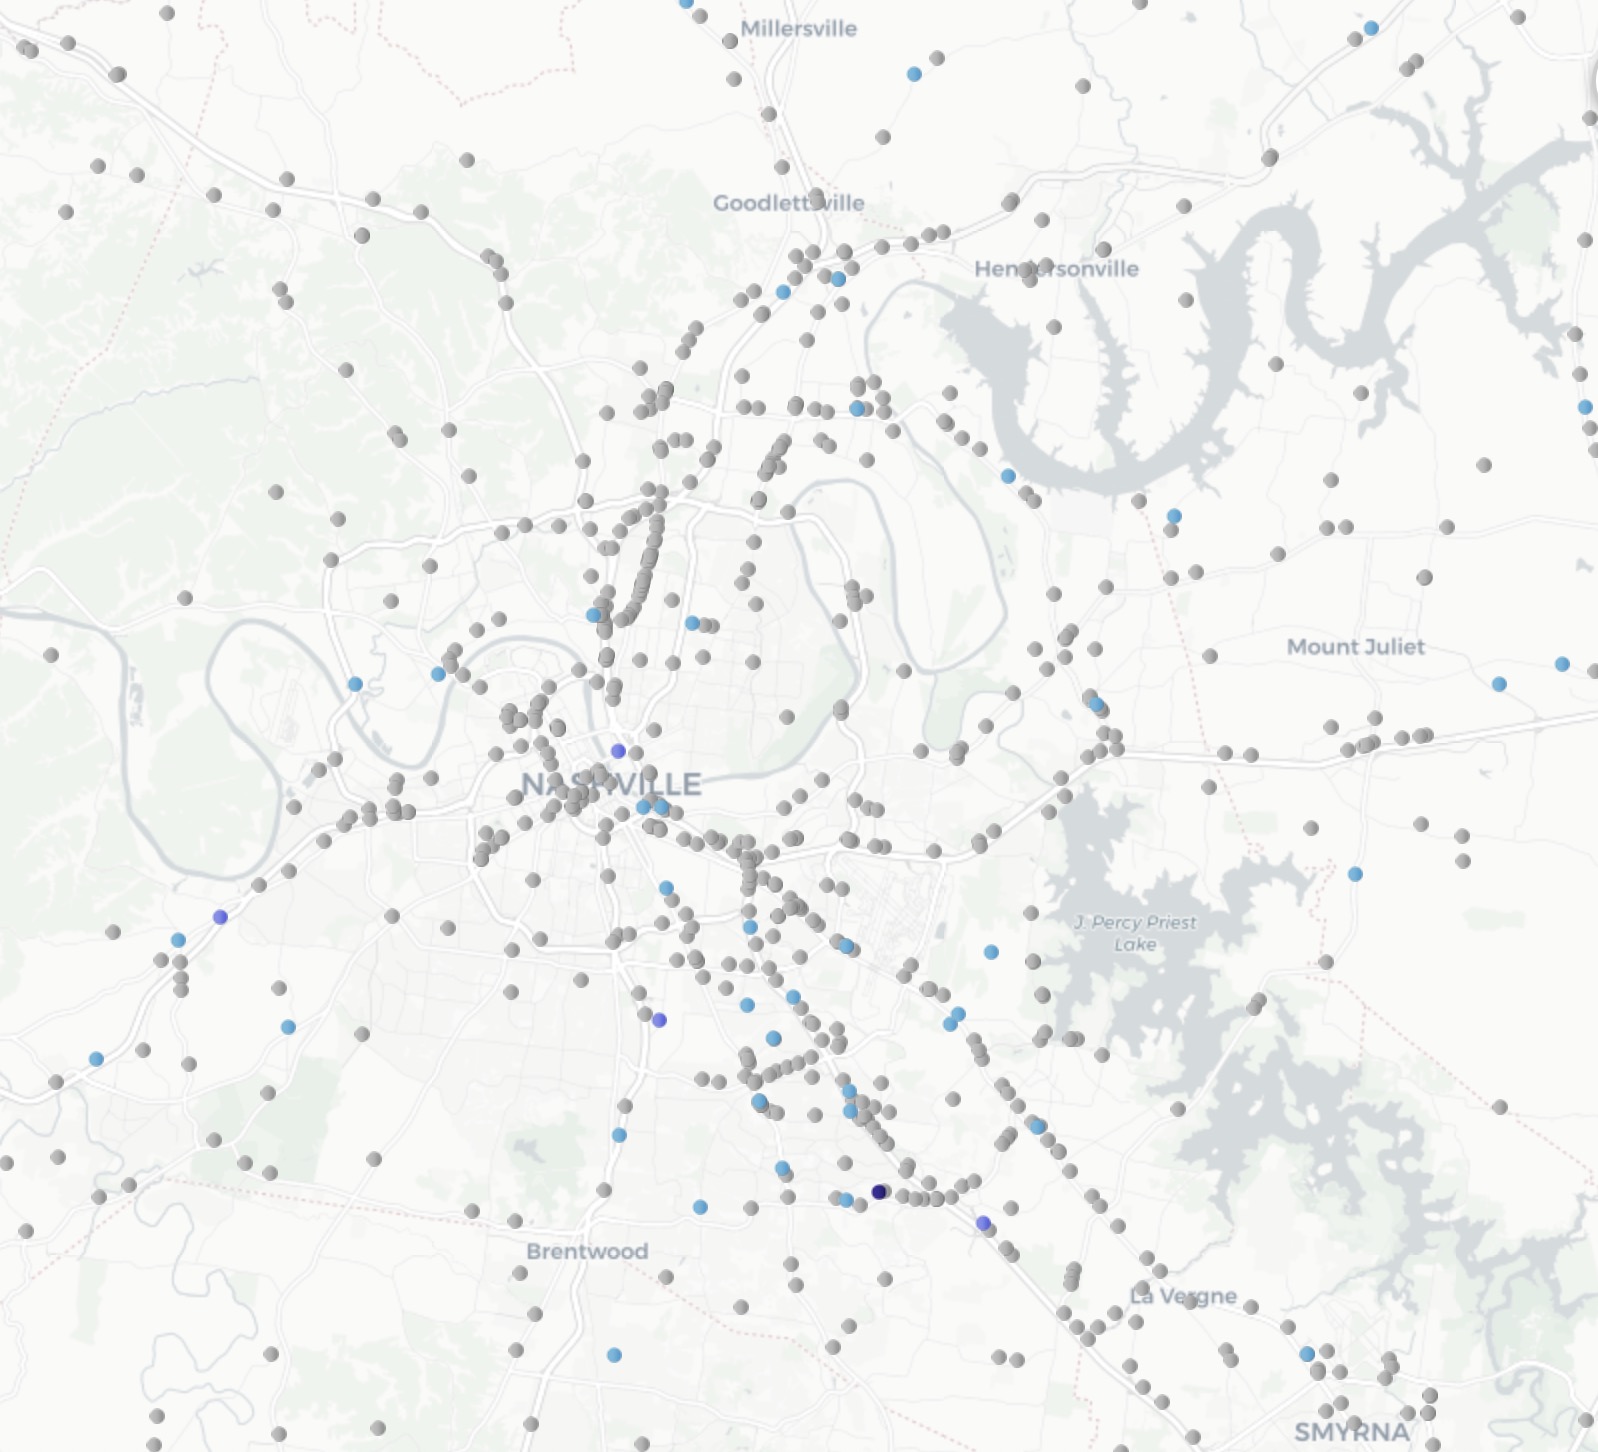
The map displays crashes based on the number of fatalities per incident. Different colors represent different severity levels. As a result, users can quickly identify patterns and high‑risk areas across the state.
___________________
Crash Categories
Crashes are grouped into six severity levels:
1 Fatality: Represents crashes where one person was killed.
2 Fatalities: Indicates crashes involving two deaths.
3 Fatalities: Shows crashes with three fatalities.
4 Fatalities: Represents incidents where four individuals were killed.
5 Fatalities: Indicates crashes involving five deaths.
6 Fatalities: Represents high-severity crashes with six fatalities.
This classification allows for clear comparison between lower- and higher-severity incidents.
____________
Features:
Crash Distribution by Area
The map shows where fatal crashes occur most frequently. For example, higher concentrations appear near major urban centers such as Nashville. In addition, clusters are visible along interstate highways and primary transportation corridors.
Severity Visualization
Each crash is color‑coded according to the number of fatalities. Therefore, users can quickly distinguish between less severe and more severe incidents.
Density Map Option
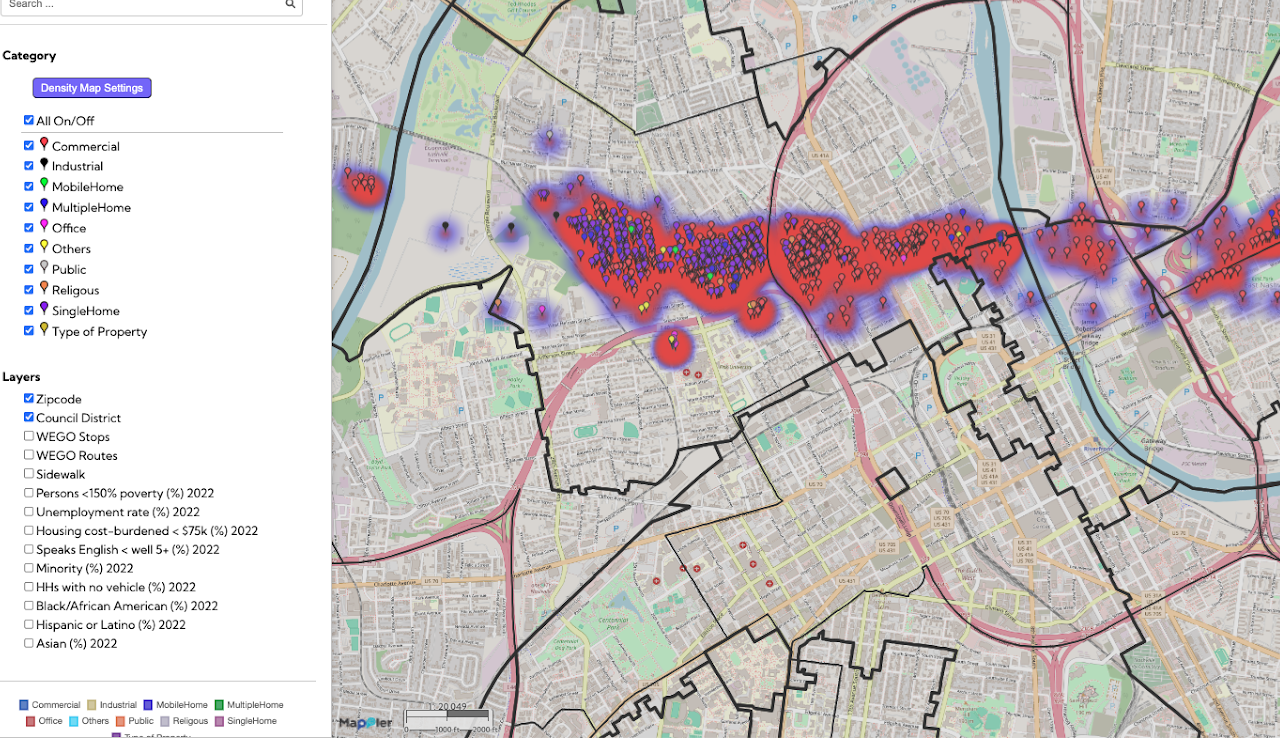
A density view highlights clusters of fatal crashes. This helps identify high‑risk corridors and recurring hotspots.
Location Search
Users can search for specific cities or regions within Tennessee. This makes it easier to analyze local crash patterns.
Category Filtering
Users can toggle fatality categories (1–6) on or off. This feature allows for more focused analysis of crash severity levels.
_____________
Objective:
The purpose of this project is to raise awareness about roadway safety across Tennessee.
By highlighting where fatal crashes occur and how severe they are, the map supports informed decision‑making in transportation planning and public safety.
Furthermore, it assists policymakers, traffic safety officials, and local communities in identifying high‑risk areas. Ultimately, this type of spatial analysis can support targeted prevention strategies aimed at reducing future fatalities.
Data source: National Highway Traffic Safety Administration (NHTSA) – Fatality Analysis Reporting System (FARS).