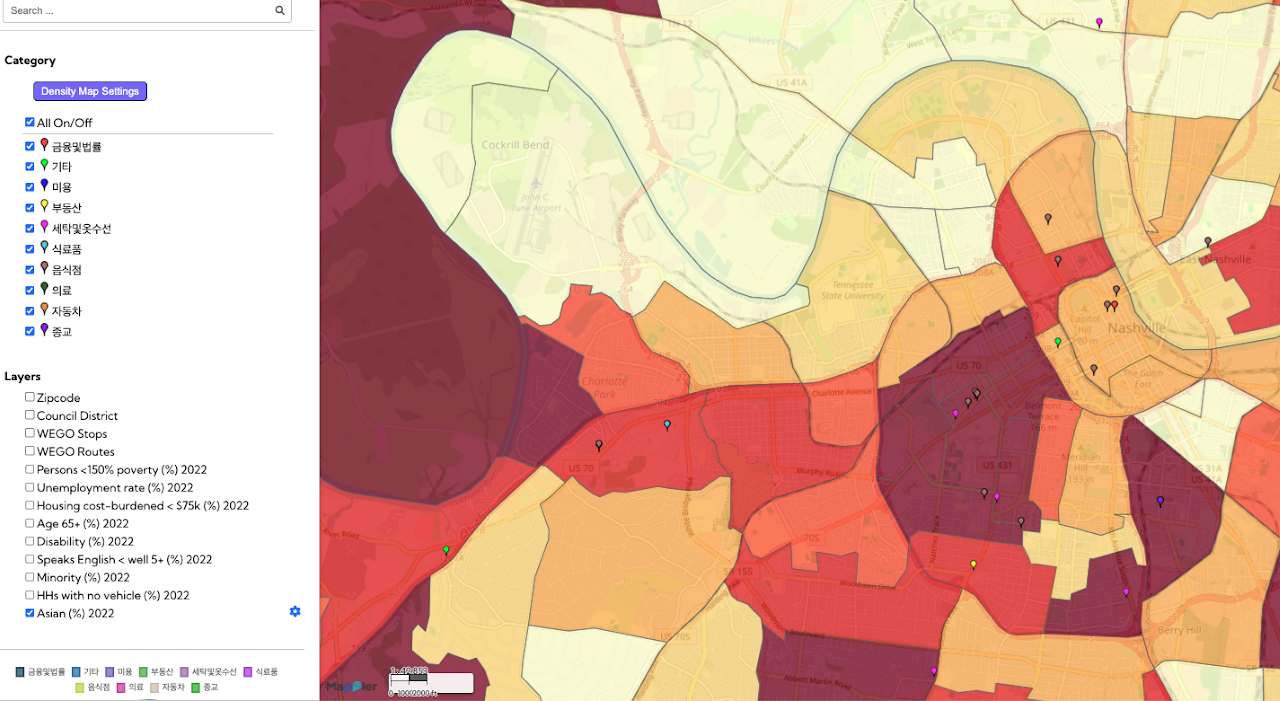
This Korean Community Resource Mapping project visually documents a variety of resources essential to Nashville’s Korean community. The map includes key cultural and social support assets such as restaurants, ethnic groceries, churches, and
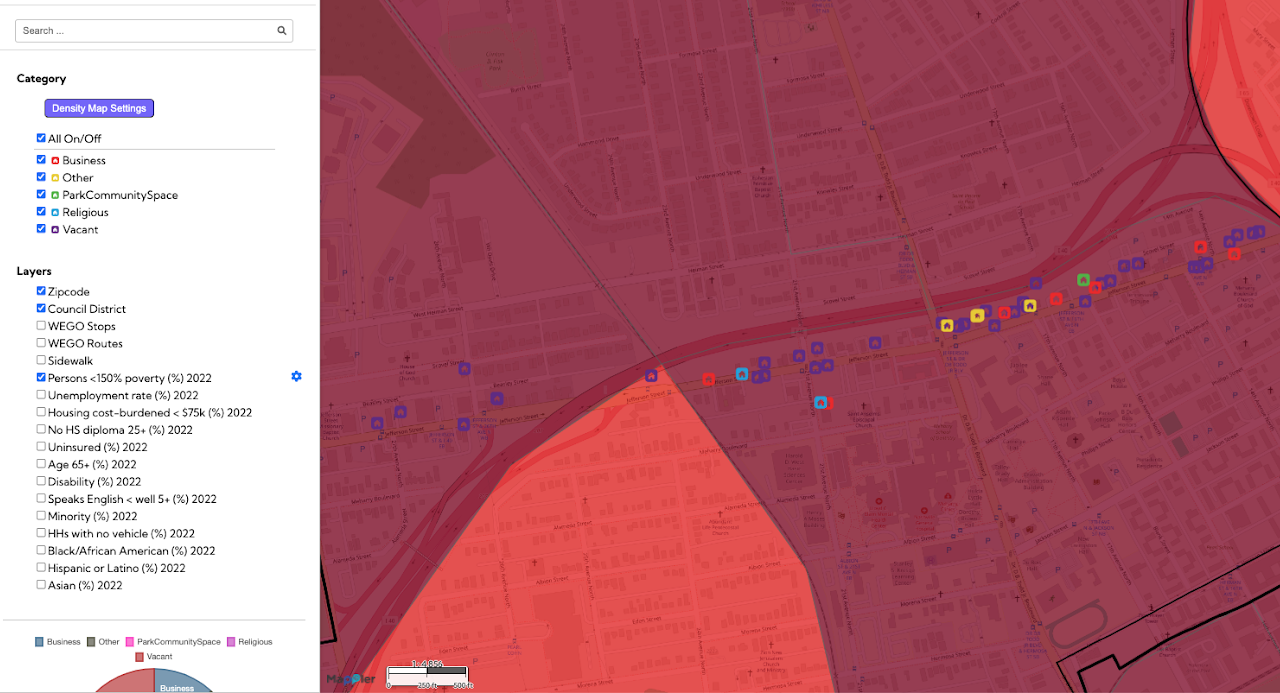
Jefferson Street community mappingJefferson Street community mapping
This Jefferson Street community mapping, a Public Interest Technology initiative, provides a detailed visual inventory of properties and land use along the historic Jefferson Street corridor in Nashville. The map
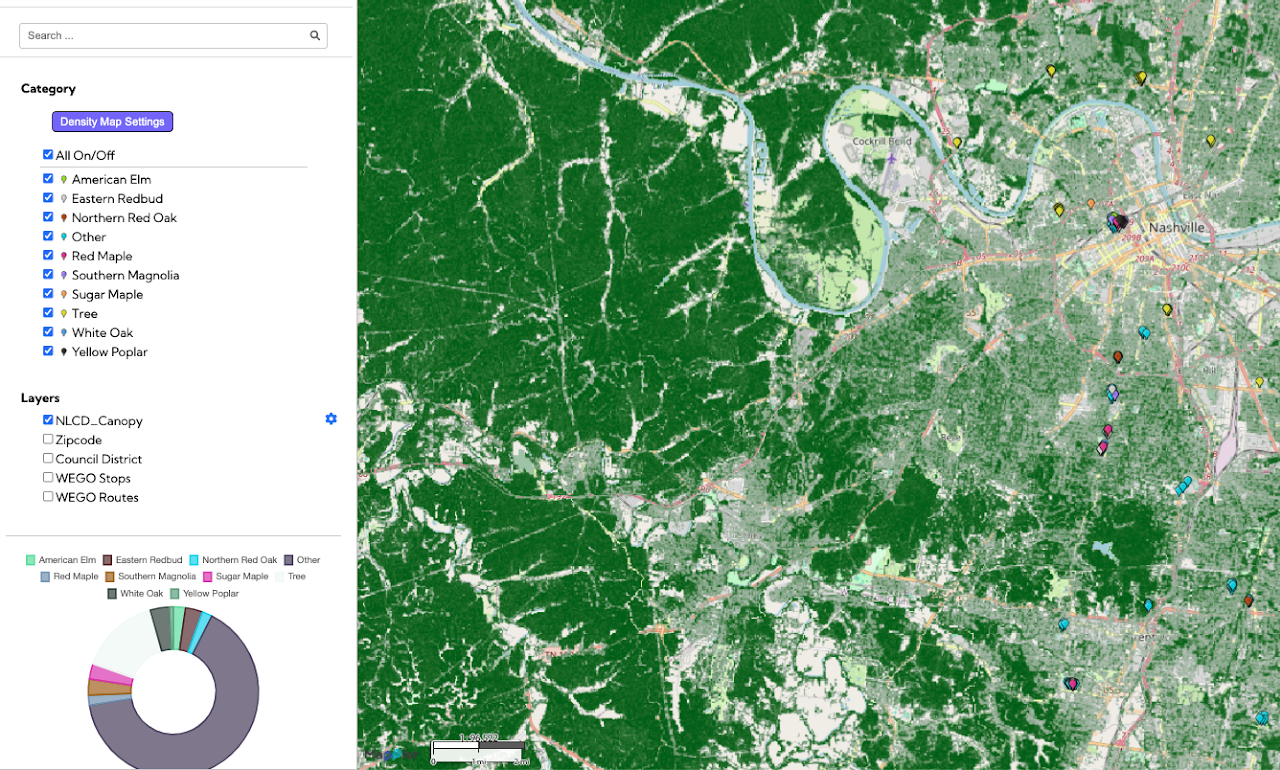
Nashville Tree MappingNashville Tree Mapping
This Nashville Tree Mapping project, a Public Interest Technology initiative, provides a detailed geographic record of trees and green spaces within a specified urban area of Nashville. By visualizing the location and presumably the
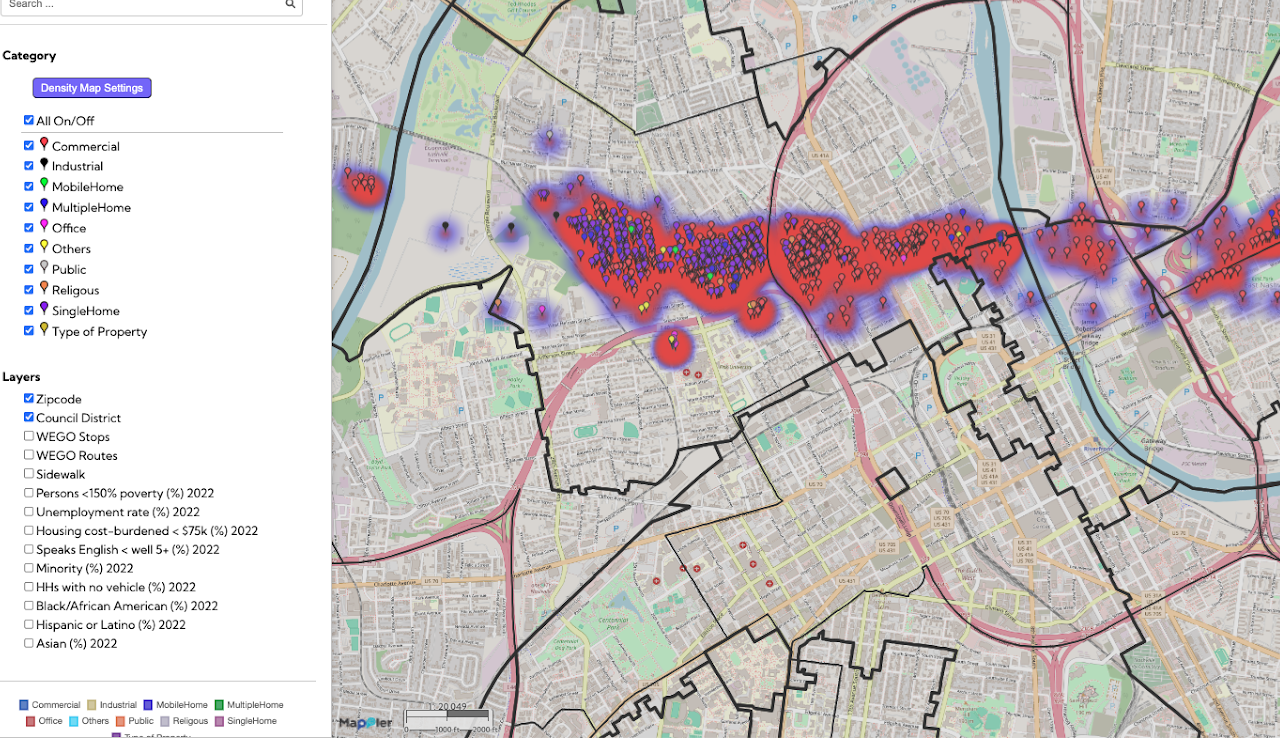
Post Assesment of Nashville Tornado 2020Post Assesment of Nashville Tornado 2020
The Nashville Tornado 2020 Post-Assessment map provides a detailed geographic record of property conditions following the devastating 2020 tornado. This initiative tracks vital recovery metrics, categorizing locations as rebuilt, renovated, repaired, or demolished, while
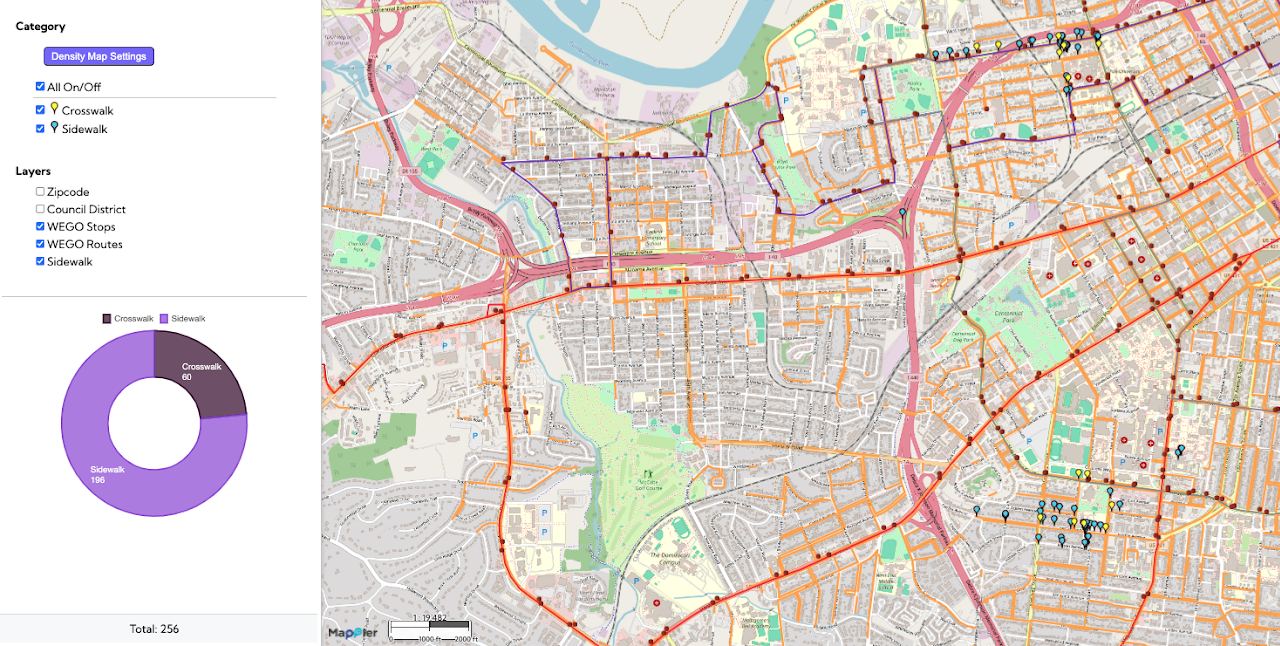
Nashville Safe Routes to SchoolNashville Safe Routes to School
This Safe Routes to School / Pedestrian Safety map visualizes key elements of the walking environment near schools in Nashville, specifically highlighting the locations of sidewalks and crosswalks. By mapping these features alongside
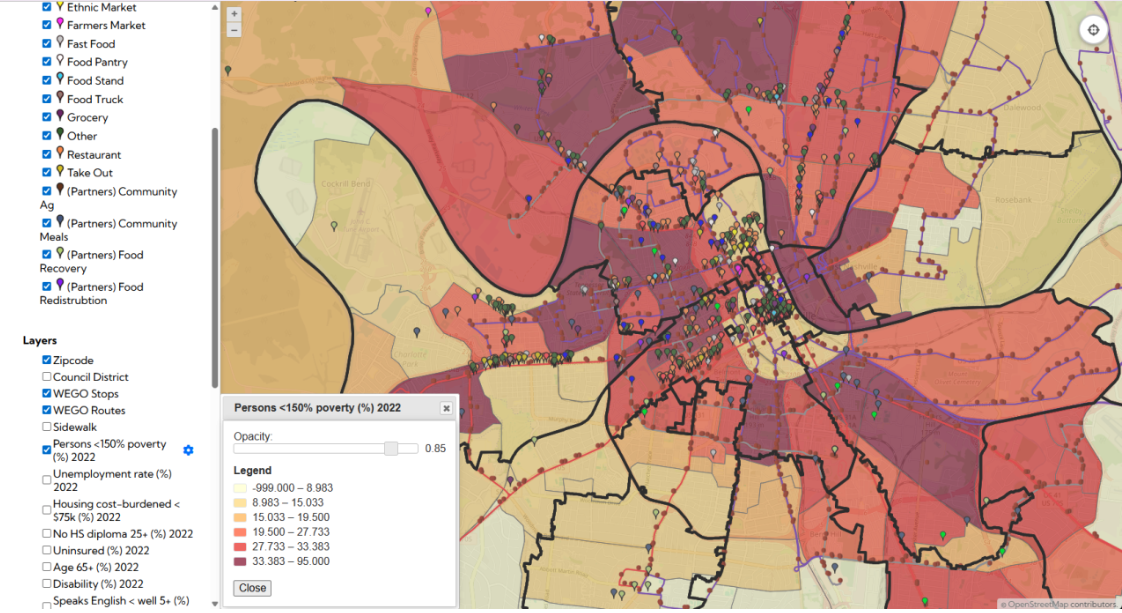
Nashville Food Resources MapNashville Food Resources Map
The Nashville Food Resources map, developed with The Nashville Food Project, provides a clear picture of where all food sources are located in the city—from groceries and farmers markets to pantries and
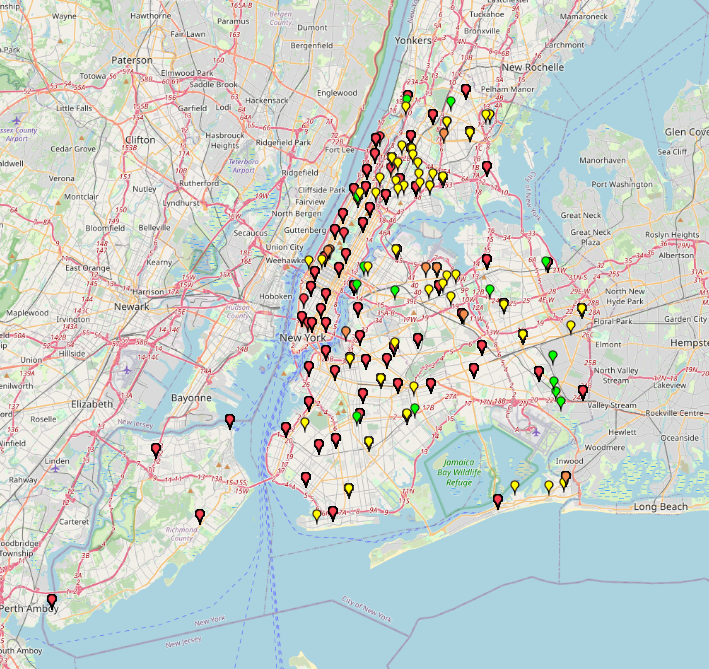
NYC Juvenile Offenses 2025: Crime Mapping by TypeNYC Juvenile Offenses 2025: Crime Mapping by Type
“NYC Juvenile Offenses:Crime Mapping by Type” is a map based on NYPD Arrest Data 2025 data in New York City. It visualizes child abuse, abandonment, luring and sexual offenses by crime
NYC Structural Accident Response Map by Type (2014-2022)NYC Structural Accident Response Map by Type (2014-2022)
This map shows the types of structural accidents and where they occurred in New York City from 2014 to 2022. The incidents are categorized into 8 different types: Collapse, Collision, Construction
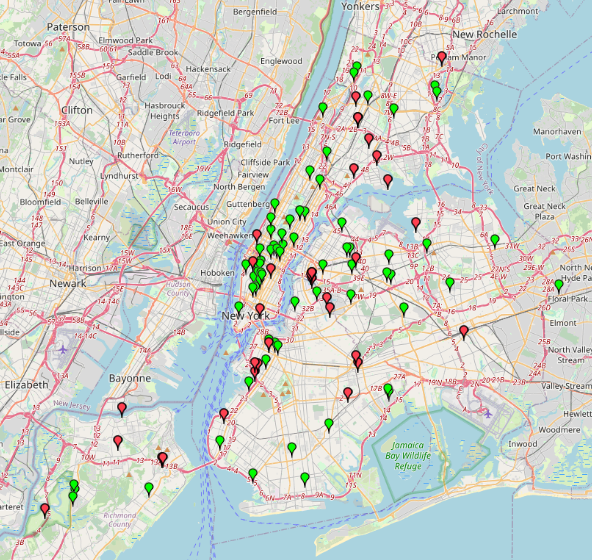
Electronics & Metals Drop Off Locations in NYC 2025Electronics & Metals Drop Off Locations in NYC 2025
A list of locations where NYC residents can drop off unwanted electronics and materials such as metal scraps. The locations are categorized by their service hours (whether they are open
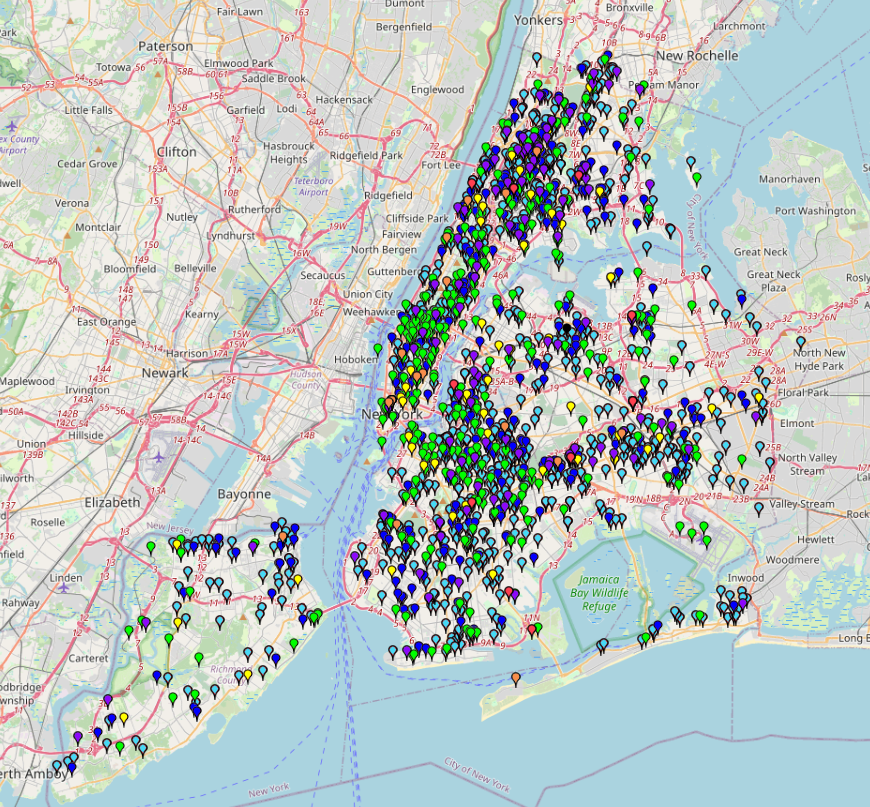
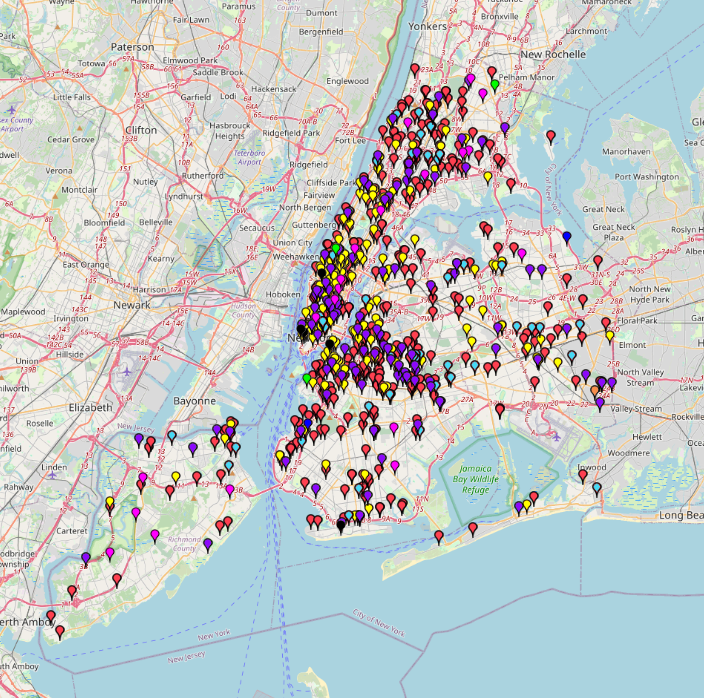
New York’s Fire Hotspots by Alarm Level (2014–2022)New York’s Fire Hotspots by Alarm Level (2014–2022)
This map shows fire response incidents in New York from 2014 to May 2022. You can see when and where fires occurred, as well as the types of alarm levels